Exercises
Exercises
Exercise 1
The goal of this exercise is to understand the winner’s curse, i.e. the bias that arises when we use the score (e.g. the mean-squared error) of the winner of a model selection as the estimate of the true test error. Concretely, for this exercise, we cross-validate ten polynomial degrees and report the smallest of the ten scores as our estimate of the test error.
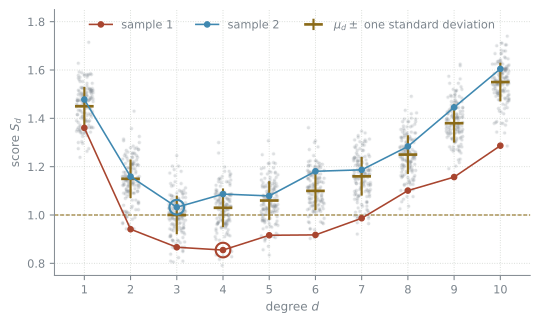
Let \(S_1, \dots, S_{10}\) be the ten scores and assume each one is unbiased, so \(\mathrm{E}[S_d] = \mu_d\). Show that \(\mathrm{E}\bigl[\min_d S_d\bigr] \le \min_d \mu_d\).
Hint: compare \(\min_j S_j\) with one fixed \(S_d\), for every possible outcome of the scores. Then take expectations.
When does equality hold. Say what that condition means in words.
Hint: let \(d^*\) be the degree with the smallest \(\mu_d\). The inequality is an equality exactly when \(\mathrm{E}\bigl[\min_j S_j\bigr] = \mathrm{E}[S_{d^*}]\). Since \(\min_j S_j \le S_{d^*}\) for every outcome, when can the two expectations agree?
The difference \(\min_d \mu_d - \mathrm{E}\bigl[\min_d S_d\bigr] \ge 0\) is the optimism of the reported score. The ten scores are not independent, because they come from the same folds of the same data. Does that make the optimism larger or smaller than for ten independent scores with the same means and variances. Argue informally.
Exercise 2
We have daily gene expression measurements from 12 patients, measured every day for 31 days. We want to predict tomorrow’s expression from today’s. Three cross-validation schemes are proposed.
- Standard 10-fold cross-validation, with the 360 rows (12 patients times 30 next-day predictions) assigned to folds at random.
- Leave-one-patient-out cross-validation: 12 folds, each holding out all 30 rows of one patient.
- A time-based split: train on all rows whose target day is 2–20, for every patient, and validate on all rows whose target day is 21–31.
For each of the two goals below, say which scheme is appropriate and why the others are optimistic or pessimistic.
- Predict tomorrow’s expression for a new patient who is not in the study, using only that patient’s measurement today.
- Predict tomorrow’s expression for a patient already in the study, using everything observed up to today.
Exercise 3
You are given the following artificial data set. The data is not linearly separable, meaning that there is no linear decision boundary that would perfectly separate the blue from the red data points.
import matplotlib.pyplot as plt
import numpy as np
import pandas as pd

rng = np.random.default_rng(42)
cldata = pd.DataFrame(2 * rng.random((400, 2)) - 1, columns=["x1", "x2"])
cldata["y"] = cldata["x1"] ** 2 > cldata["x2"]

plt.scatter(cldata["x1"], cldata["x2"], c=cldata["y"].astype(int), cmap="coolwarm")
plt.xlabel("$X_1$")
plt.ylabel("$X_2$")
plt.show()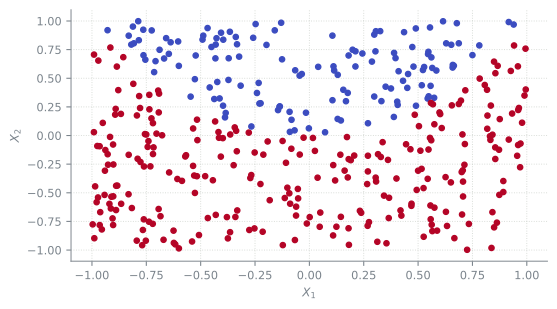
- Find a 2-dimensional feature representation \(H_1 = f_1(X_1, X_2)\), \(H_2 = f_2(X_1, X_2)\), such that the transformed data is linearly separable.
- Generate a similar plot for the transformed data to visualize that the decision boundary has become linear for the transformed data.
Exercise 4
Open the illustration on tuning.
- Set the strategy to the single 50/50 split and move \(n\) from 25 to 500, writing down “within one of it” at each \(n\). It gets worse. Explain why in two sentences, using the shape of the true error curve.
- Set \(n = 500\) and step through all four strategies. Rank them on “how often it is chosen”. Then look at the width of the band near the best degree instead, and say whether the ranking is the same.
- At \(n = 25\) all four strategies land within one of the right degree 74% to 84% of the time. Is model selection easy when data is scarce? Look at “how often it is chosen” and at the true error curve before you answer.
Exercise 5
The code below was written by a language model, asked for cross-validated ridge regression with feature standardization on a gene expression data set. It runs without an error and reports a good score.
It contains three leaks. Each one on its own makes the reported score too good.
import numpy as np
from sklearn.linear_model import Ridge
from sklearn.model_selection import KFold, cross_val_score
from sklearn.preprocessing import StandardScaler

X, y = load_expression_data()          # X: (200 patients, 5000 genes)

# 1. standardise the features
scaler = StandardScaler()
Xs = scaler.fit_transform(X)

# 2. keep the 100 genes most correlated with the outcome
corr = np.array([np.corrcoef(Xs[:, j], y)[0, 1] for j in range(Xs.shape[1])])
top = np.argsort(-np.abs(corr))[:100]
Xs = Xs[:, top]

# 3. tune the ridge penalty
best_alpha, best_score = None, -np.inf
for alpha in [0.01, 0.1, 1, 10, 100, 1000]:
    score = cross_val_score(Ridge(alpha=alpha), Xs, y,
                            cv=KFold(5, shuffle=True, random_state=0),
                            scoring="neg_mean_squared_error").mean()
    if score > best_score:
        best_alpha, best_score = alpha, score

print(f"alpha = {best_alpha}, CV MSE = {-best_score:.3f}")- Find all three leaks. For each one, say exactly which information moves from the held-out data into the fitted model.
- Rank them by how much damage they do, given \(n = 200\) and \(p = 5000\). One of them is far worse than the others at these dimensions. Which one, and why.
- Rewrite the script so that the number it reports is honest. You will need a
Pipelineand a nested loop. - Before you run your version, write down whether you expect the score to get better or worse, and by roughly how much. Then run it.
Hint: the pipeline and the nested loop are both on tuning. The selection step is the one piece the website does not show — SelectKBest(f_regression, k=100) from sklearn.feature_selection is a transformer, so it goes in the pipeline like StandardScaler does.
Exercise 6
Suppose you receive the following email of a colleague of yours. Write an answer to this email.
Hi
In my internship I am doing this research project with a company that manufactures constituents for medical devices. We need to assure high quality and detect the pieces that are not fully functional. To do so we perform 23 measurements on each piece. My goal is to find a machine learning method that detects defective pieces automatically. Both, my training set and my test set consist of 4000 pieces that were fine and 30 defective ones. I ran logistic regression on that data and found a training error of 0.1% and a test error of 0.3%, which is already pretty good, I think, no? But with kNN classification it is even better. For \(k = 7\) I found a test error of 0.05% which is by far lower than all test errors I obtained with other values of \(k\). I was really impressed. Now we have a method that predicts with 99.95% accuracy whether a piece is defective or not!
Because you are taking this machine learning class now, I wanted to ask you for advice. Does it all make sense to you what I described? If not, do you have any suggestion to get even better results?
À bientôt Jamie