import numpy as np
import matplotlib.pyplot as plt
from sklearn.tree import DecisionTreeRegressor, DecisionTreeClassifier, plot_tree

rng = np.random.default_rng(10)

def f(x):
    return np.sin(2 * x) + 2 * (x - 0.5) ** 3 - 0.5 * x

x = rng.uniform(0, 1, 80)
y = f(x) + rng.normal(0, 0.15, 80)
X = x.reshape(-1, 1)
grid = np.linspace(0, 1, 500).reshape(-1, 1)Decision trees
Examples
A regression tree splits the input space into rectangles and predicts the mean of the training responses in each rectangle.
Recursive binary splitting
We cannot try all possible partitions, so we build the tree greedily. At each step we look at every predictor \(j\) and every threshold \(s\), and choose the pair that reduces
\[ \sum_{i: x_{ij} < s} (y_i - \bar y_{\text{left}})^2 + \sum_{i: x_{ij} \ge s} (y_i - \bar y_{\text{right}})^2 \]
the most. Then we repeat inside each of the two halves.
This is greedy. The split we take first is the best single split, not necessarily the first split of the best tree.
For classification we replace the sum of squares by the Gini index or the entropy, both of which measure how mixed the classes are in a node.
Fitting
Depth 1 is a single split, so the prediction takes two values. Depth 10 has almost one leaf per point and fits the noise.
The steps are visible. A tree cannot produce a smooth function, which is its main weakness for a problem like this one. It is a strength when the true relationship really does have thresholds.
Reading a tree
t = DecisionTreeRegressor(max_depth=2).fit(X, y)

fig, ax = plt.subplots(figsize=(6.6, 3.2))
plot_tree(t, ax=ax, filled=False, feature_names=["x"], precision=2, fontsize=7)
plt.show()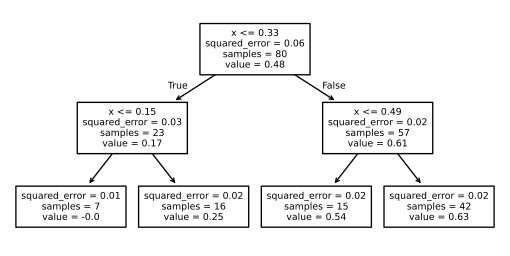
This is the main attraction of a single tree. Anyone can read it, and it can be explained to someone who does not know what a model is.
Two dimensions
Every boundary is parallel to an axis. A diagonal boundary has to be approximated by a staircase, which needs many splits.
The problem with a single tree
A single tree has high variance. Change a few points and the first split can change, which changes everything below it.
The fix is to average many trees. That is the next page.